Most event reports are full of activity metrics that do not mean enough to leadership. Here’s the Event ROI Matrix – a practical framework for measuring real business impact from enterprise events.
What Is Event ROI?
Event ROI (Return on Investment) measures the business value generated by an event compared to the cost of producing it. While many teams focus on attendance and engagement metrics – enterprise organizations evaluate event ROI through revenue impact, customer retention, pipeline acceleration, and business outcomes.
Introduction: The event ROI problem nobody talks about
Ask most event teams how they measure ROI, and you’ll get one of two responses.
The first is a list of metrics: registrations, attendance numbers, NPS scores, and maybe some session ratings. Thorough looking. Professionally formatted. And yet almost entirely disconnected from the business outcomes leadership actually cares about.
The second – more common than most people admit – is silence. A pause followed by words about “quality” and “attendee experience” that eventually trail off without answering the question.
This is the event ROI problem. Not that events don’t create value – they do. The problem is that the industry has trained event teams to measure the wrong things for so long that most professionals have never been asked to define success in business terms before an event starts.
This article breaks down exactly how to fix that, using a practical framework called the Event ROI Matrix.
Why traditional event metrics fail in the executive suite
Registration numbers, check-in counts, and NPS scores are what I call activity metrics. They tell you what happened operationally. They do not tell you what happened commercially.
When a CFO or VP reviews your post-event report, they are asking a fundamentally different set of questions:
- Did this event open or accelerate any deals?
- Did it protect our most important customer relationships?
- Was this the best use of the budget compared to any other investment we could have made?
If your report cannot answer those questions with specific numbers and a clear narrative, you are not reporting ROI. You are reporting logistics – and over time, that distinction is what gets event budgets cut.
The shift required is not just a measurement shift. It is a strategic one: defining what the event is for before it begins, rather than scrambling to justify it after it ends.
The raw KPIs that actually matter
Before mapping results into any framework, you need the right inputs. These are the six event KPIs I track with every enterprise team:
- Show-up rate vs registrations- If 1,000 people register and 500 attend, your show-up rate is 50%. That is a significant data point — not just about logistics, but about how compelling your pre-event communication was. A weak show-up rate is the first signal that something upstream broke.
- Session attendance depth – Did attendees actually go into sessions and workshops, or did they walk the floor and leave? The gap between total event attendance and session attendance tells you whether your programming created genuine pull or just a social occasion.
- Content consumption- How much of the content you distributed – videos, whitepapers, decks, product demos – was actually downloaded and engaged with? This is one of the most underused signals in event measurement. Content consumption is a direct indicator of audience intent.
- Networking activations- How many real connections were made – QR code scans, meetings booked, introductions facilitated? 1,000 attendees and 50 activations is not a networking success. It is a missed opportunity that a better-programmed event would have converted.
- Value per attendee- Every person in your event has a potential dollar value to your business. A senior decision-maker from a key account may represent a $5 million opportunity. A junior contact from a smaller company may represent $5,000. If you treat both as “1 attendee” in your reporting, you cannot have a credible pipeline conversation.
- Conversions and revenue generated- All other metrics lead here. How many attendees entered the pipeline? How many deals were opened, accelerated, or closed as a direct result of this event? What is the total dollar value of revenue the event touched? This is the number that ends conversations in CFO reviews.
Introducing the Event ROI Matrix
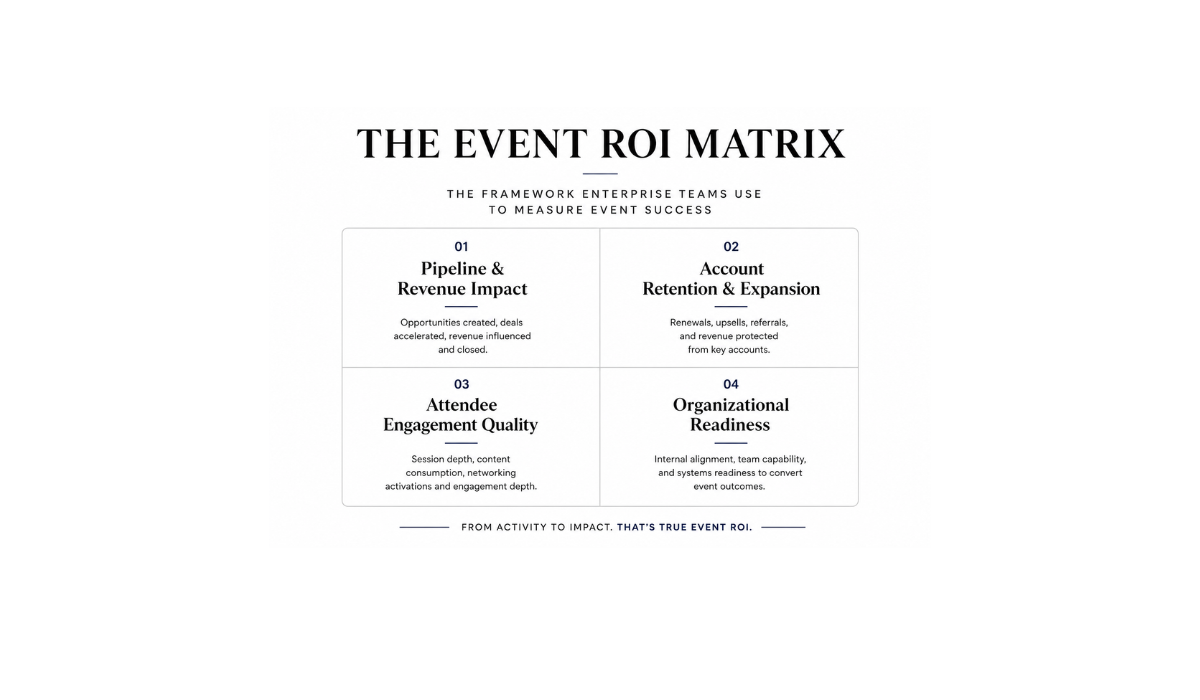
The Event ROI Matrix organizes your raw KPIs into four strategic quadrants that tell a complete commercial story – one that leadership can understand, interrogate, and act on.
Quadrant 1: Pipeline & Revenue Impact
This is the full commercial story of the event: opportunities opened, deals accelerated, contracts signed, and the total dollar value the event directly influenced. This quadrant answers the question your CFO leads every review with – “What did we get back?”
Practically, this means tracking which pipeline opportunities were created or moved forward during or immediately after the event, and attributing revenue outcomes back to event touchpoints wherever possible.
Quadrant 2: Account Retention & Expansion
This quadrant captures the money you protected, not just the money you made – and it is the most underreported dimension of event ROI.
Which existing customers renewed a contract after attending? Which accounts upsold or expanded their relationship with you? Which attendees became referral sources? Retention is revenue. For most enterprise companies, it is the largest revenue category. Yet most event reports never put a number on it.
Quadrant 3: Attendee Engagement Quality
This quadrant moves beyond headcount to measure depth of participation: session attendance rates, content consumption per attendee, networking activations, and the ratio of passive presence to active involvement.
Engagement quality is the leading indicator that sits between “people showed up” and “revenue happened.” When engagement quality is high, conversion rates follow. When it is low, it signals that the event delivered a social experience rather than a business one – regardless of how the day felt in the room.
Quadrant 4: Organizational Readiness
This is the quadrant most enterprise teams ignore entirely – and it may be the one with the longest-term commercial value.
What did your team walk away from this event knowing that they didn’t know before? What objections can they now handle that previously cost you deals? What playbooks, case studies, or customer insights came out of this event that will sharpen your sales and marketing for the next six months?
Organizational readiness is not a soft outcome. It is a compounding commercial asset – and when you start tracking it, the true ROI of your events program becomes significantly larger than any single-event report suggests.
How to implement the Event ROI Matrix
The framework is most powerful when applied before the event, not after.
Step 1: Define the primary outcome – Choose one dominant quadrant for this event. Is it Pipeline & Revenue? Account Retention? Both are valid — but your programming, attendee list, and success metrics should all align with your primary intent.
Step 2: Map your attendee personas – List every type of attendee coming: existing customers, prospects, partners, employees, exhibitors. Each persona has a different success definition, and your reporting will need to speak to each one.
Step 3: Attach metrics per persona before the event
Customers → renewal rate, expansion conversations, referrals given.
Prospects → pipeline stages advanced, deals opened.
Partners → new collaboration agreements, joint pipeline created.
Step 4: Collect raw KPIs throughout the event – Use your event platform to track show-up rates, session attendance, content downloads, and networking activations in real time. Don’t wait until the post-event wash-up to start collecting data.
Step 5: Map into the four quadrants and build one leadership slide – Numbers, dollar values, and one specific story per quadrant. Not a 20-page report. One slide that a CFO can read in 90 seconds and walk away from knowing exactly what the event accomplished.
Common Event ROI Mistakes
After working with enterprise event teams across multiple industries, the same mistakes appear repeatedly:
No success criteria defined before the event begins. You cannot measure what you never defined. If your team cannot articulate what success looks like before the first invite goes out, no framework will rescue you in the post-event review.
One-size-fits-all communication across all attendee personas. A message that resonates with an existing enterprise customer means nothing to a cold prospect — and vice versa. The best event programs communicate differently to each persona at every stage of the event cycle.
Programming that prioritizes content delivery overactive participation. Sessions where attendees sit and listen are the lowest-engagement format available to you. The events that generate the strongest ROI are programmed with almost obsessive attention to every touchpoint — how people move through the space, where the natural connection moments are, what the room feels like at every hour of the day. Every ingredient has to be intentional, because if any key ingredient is missing, the whole production suffers.
Conclusion: Events were never unmeasurable
The persistent belief that events are somehow immune to measurement is not a feature of the medium – it is a habit of the industry.
Every event you run has a commercial story. Pipeline touched. Relationships deepened. Engagement created. Capabilities built. The Event ROI Matrix is simply a way of finding that story in the numbers you already have – and telling it in a language that leadership respects.
Define success before the venue is booked. Map your outcomes into the four quadrants. Build the one slide that tells the whole story.
When you do that consistently, events stop being a line item that finance questions every budget cycle. They become one of the most defensible investments in your commercial plan.